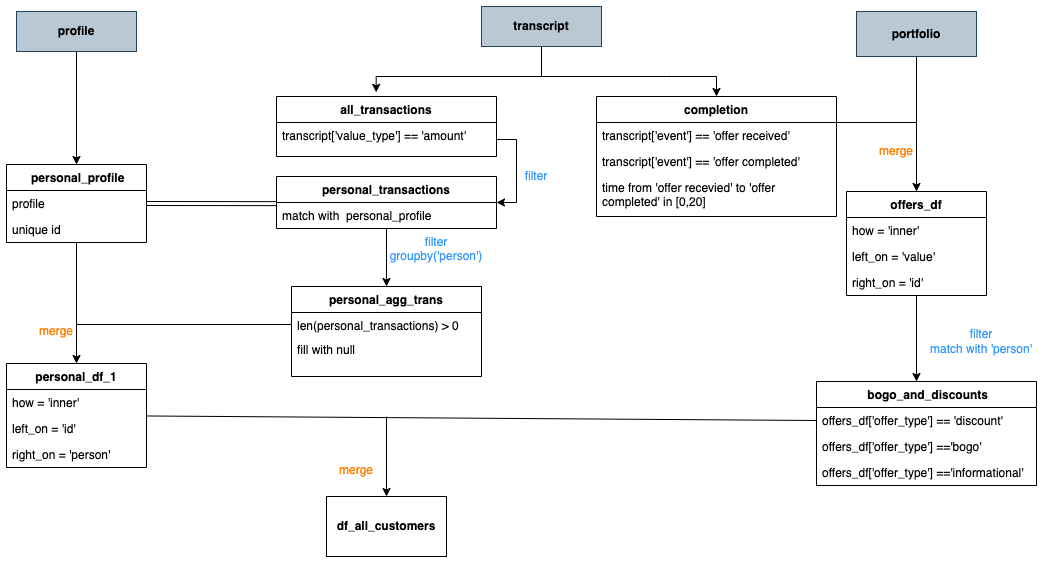
The data is contained in three files:
- portfolio.json - containing offer ids and meta data about each offer (duration, type, etc.)
- profile.json - demographic data for each customer
- transcript.json - records for transactions, offers received,offers viewed, and offers completed.
Have a look at table structure
Data Explore
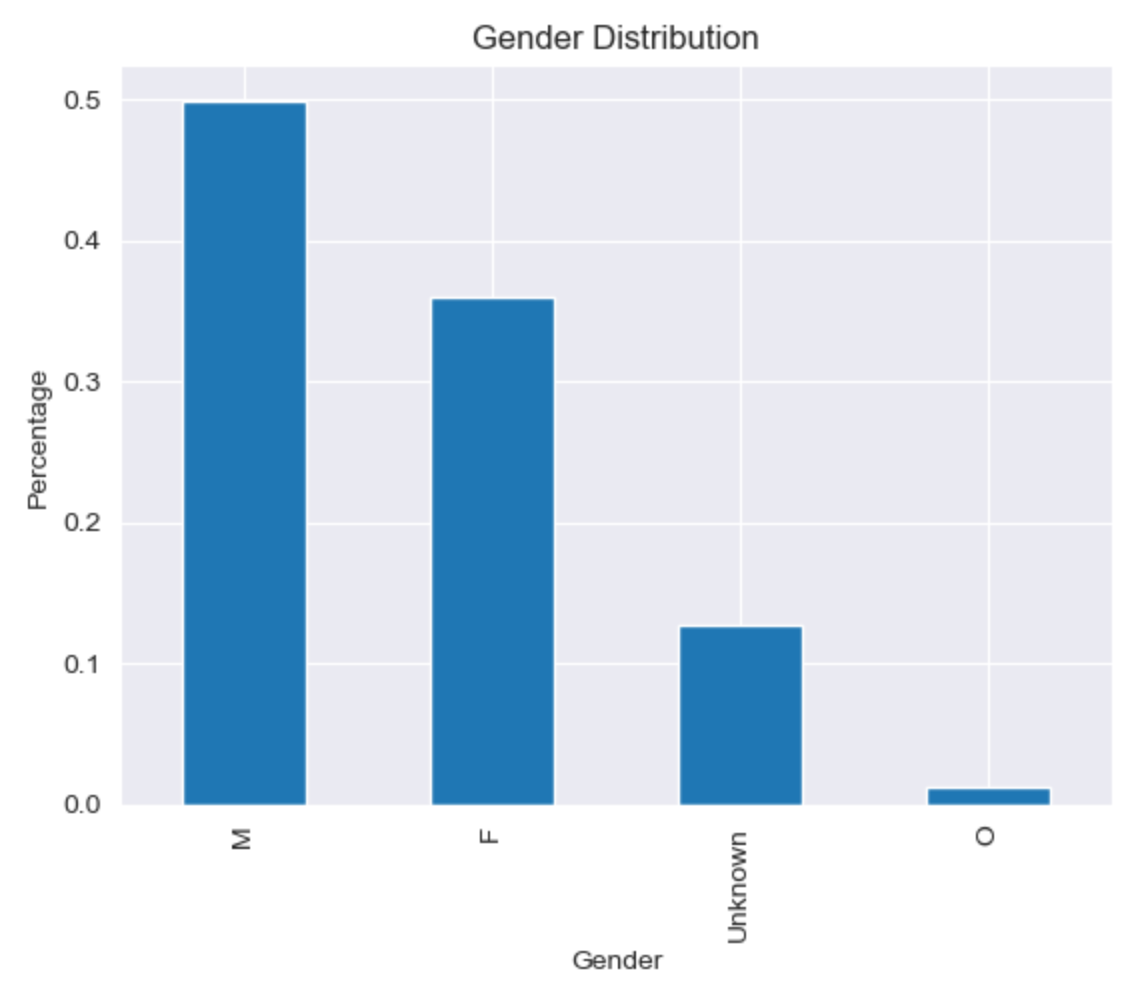
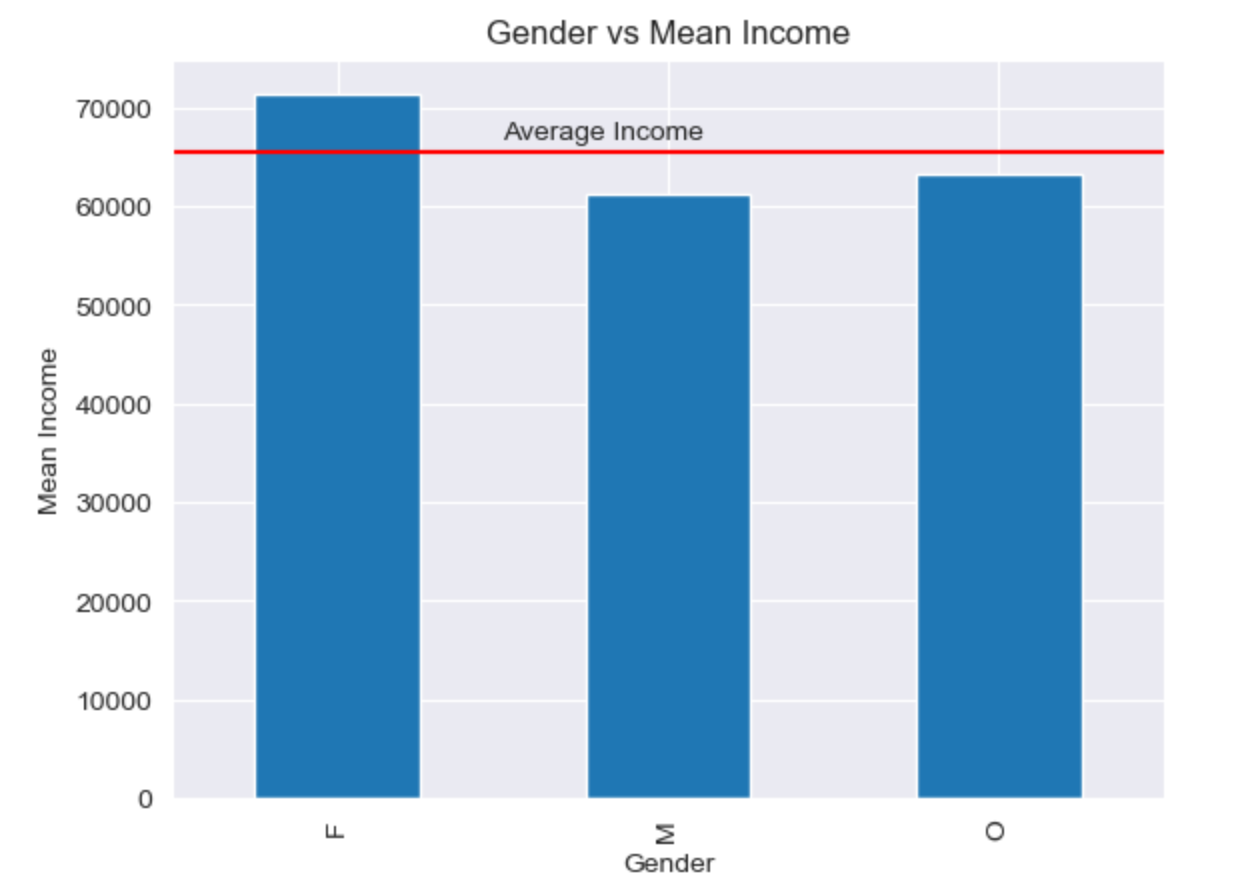
- Take a look at the distribution of gender and how gender compares to income.
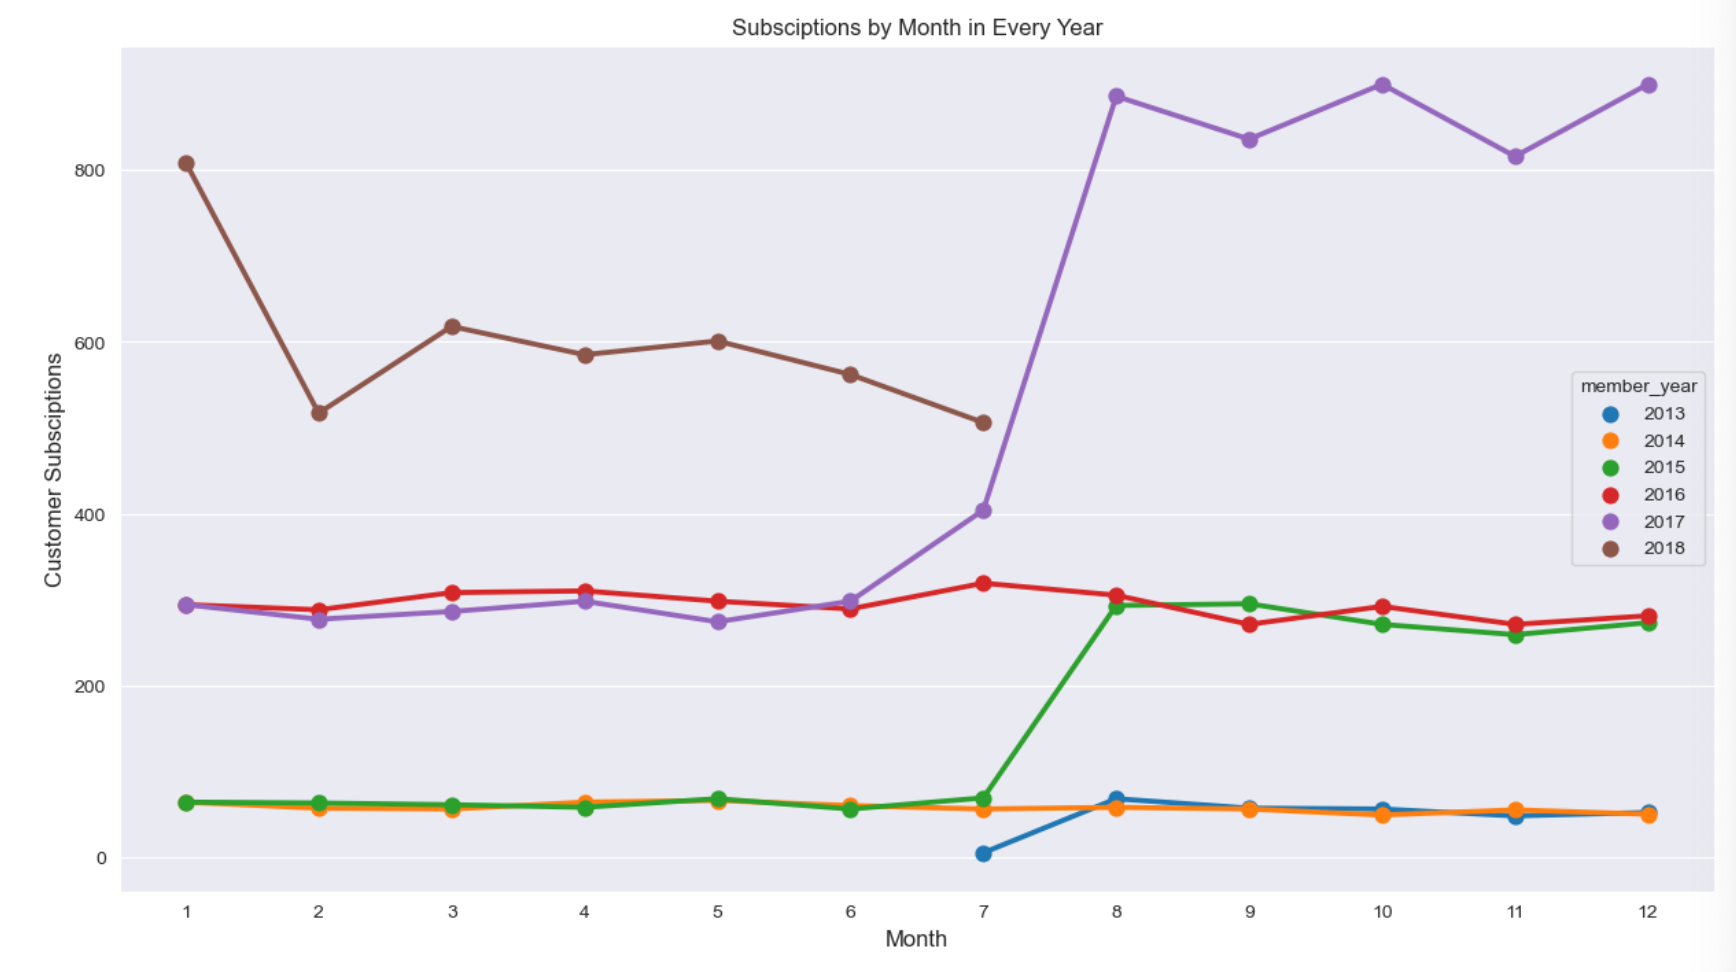
- Looking at the user subscriptions.
- How the distribution of bogo and discount rewards in customers.
Modeling
Firstly, we need to find the optimal cluster number to use KMeans model. And both interia and Silhouette methods show the best cluster number is 3.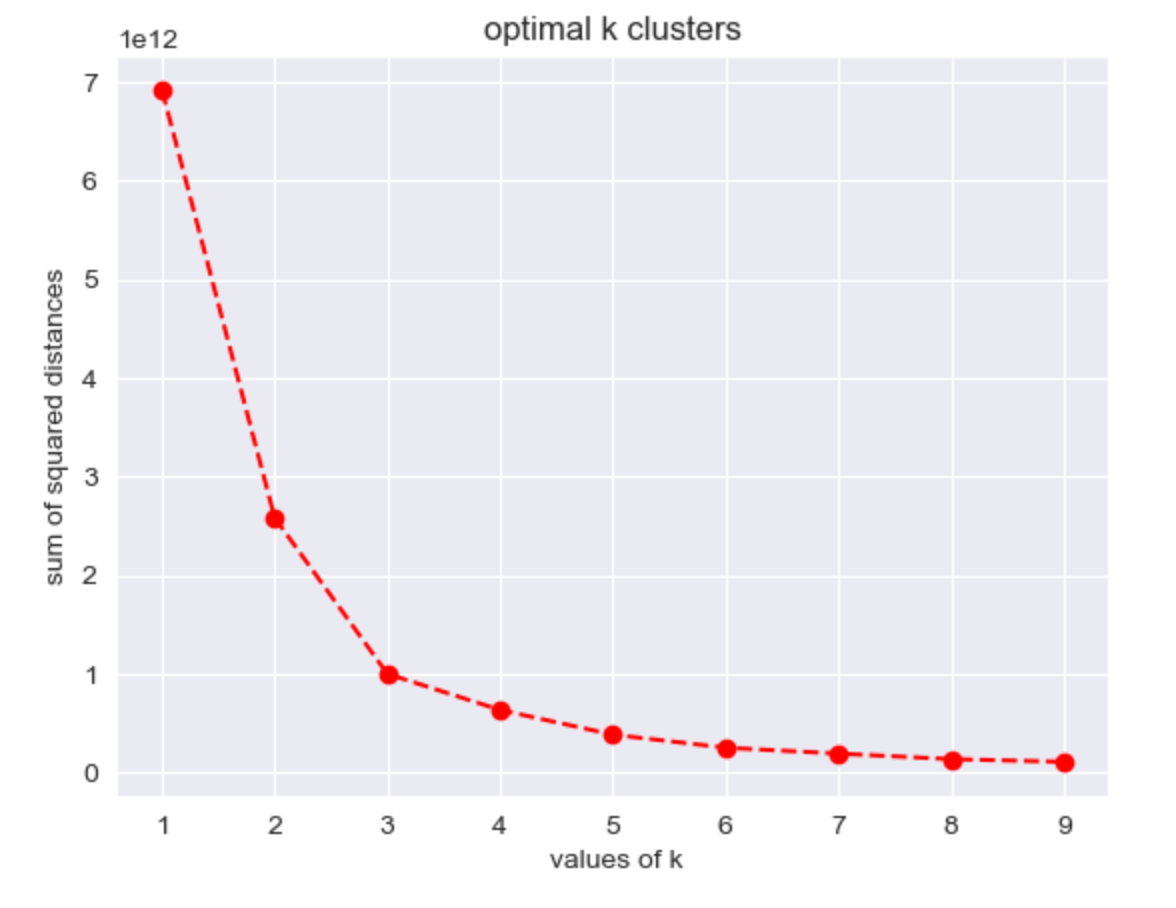

Secondly, we predict lables for each sample. And cluster1 is largest among three clusters.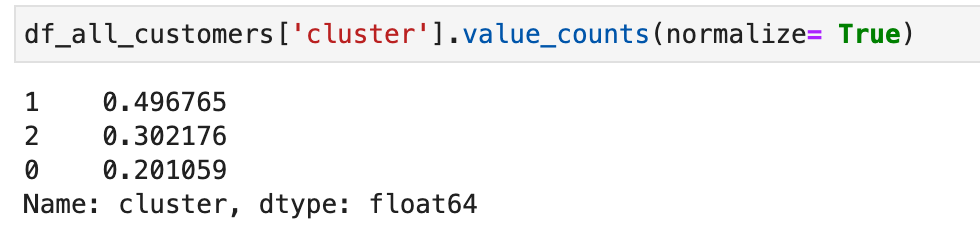
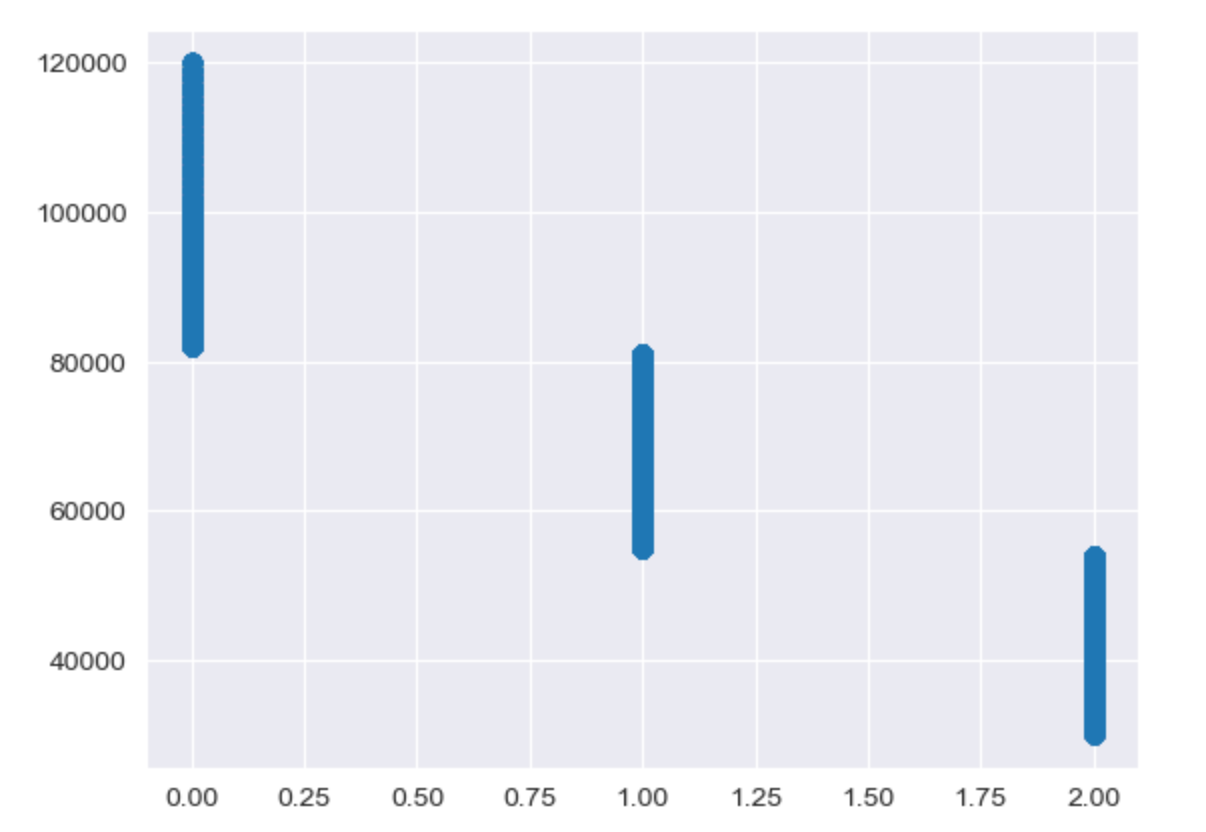
Thirdly, we could find income is a useful variable to classify customers. This picture below is about clusters and income. And the high income uses are more likely is the cluster 0.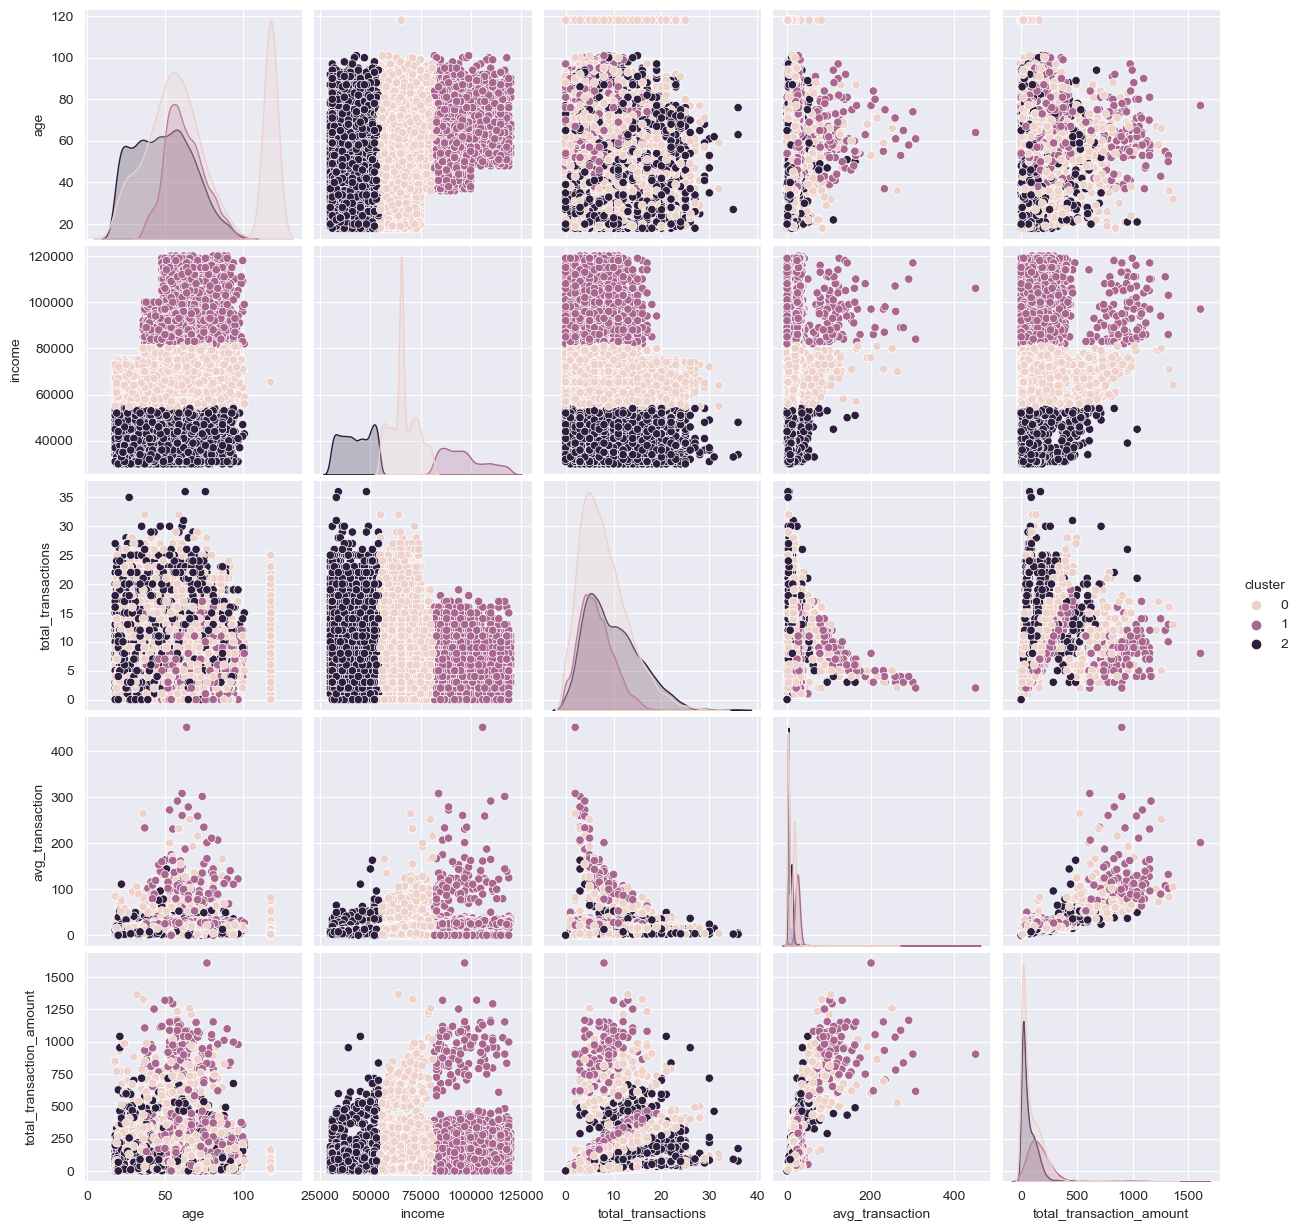
Take a look at high income cluster, the users are more respond to discount offer type.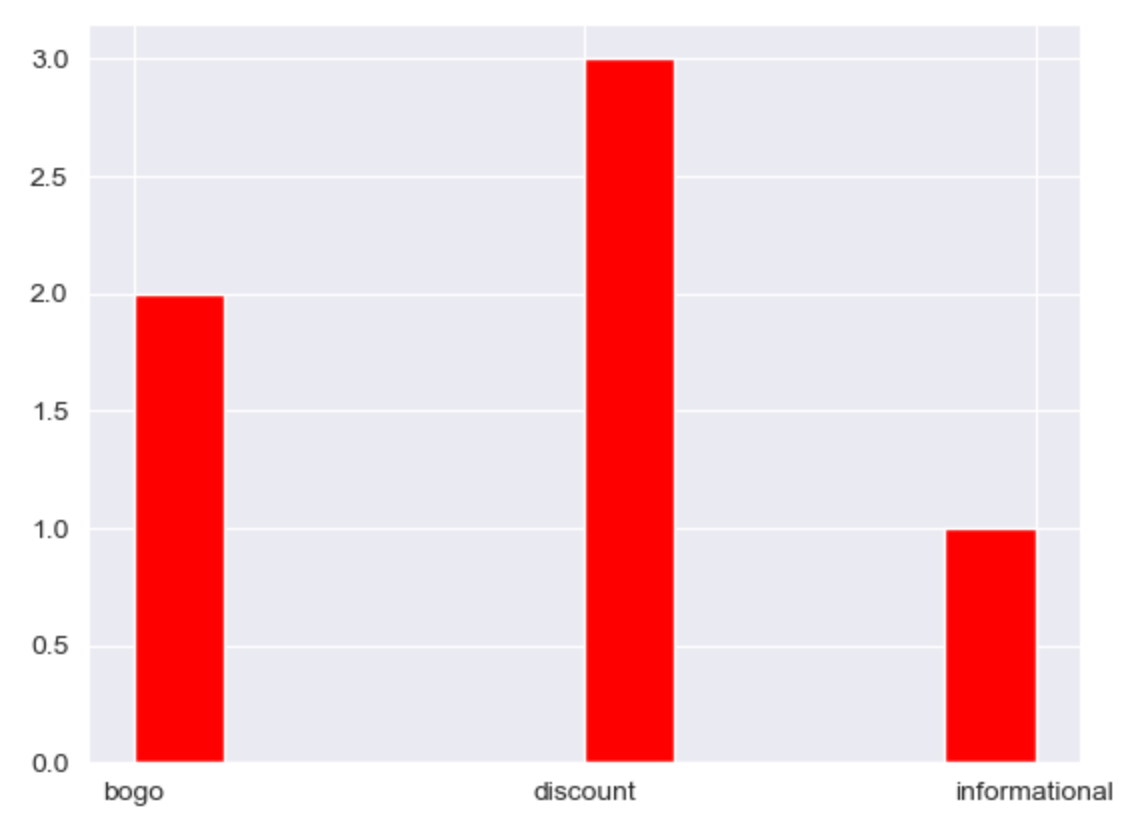
Conclusion
We use the KMeans cluster to classify customers into 3 categories, where the first category is for high income customers, the second category is for middle income customers, and the third category is for low income customers. From the sample data, the percentages of the three categories of income customers are 20.11% ,49.68%,and 30.22% respectively. The higher income customers have a lower total number of transactions, but a higher average transaction amount and a higher total transaction amount.
And we also know the high income customers are more likely respond to the discount offer type.